| Wind Watch is a registered educational charity, founded in 2005. |
Texas wind doesn’t work
Author: | Economics, Grid, Texas, Videos
Translate: FROM English | TO English
Translate: FROM English | TO English
 The American Wind Energy Association makes the claim that Texas is ranked second in the US as a wind power resource. Number one is North Dakota and you can see their recent weekly output under the Wind Output Now link in upper right corner of the blog and on the youtube video.
Texas is Boones Pickens country and we were all bombarded with commercials and television appearances by the legendary oilman who went green and hoped to construct enormous Texas style wind farms and sell us wind – to save the day!!! Let’s see how his claims stand up in reality.
Load is the term to describe the demand of electricity at a point in time and the highest load in Texas is during the summer afternoons when the air conditioning needs are the highest. This is the case for almost all of the United States. The companies plan and ensure they have enough capacity to supply the electricity for these few short months. In some areas, they have special peak units that are only used a few times per year on these very special high demand days.  The chart to the left, from here [note: the nofreewind.com domain is no longer maintained by this author], shows that at the time of peak demand only 342MW of 2300 MW of installed wind produced electricity, or 14%. (Double-click any charts to enlarge for better view) 2300 MW represents about 1500 turbines spread out across the enormous state of Texas. It’s big they say. Each of these turbines cost approximately about $2-3 million dollars to build or a total of $3-5 billions dollars was spent on these turbines which only produced 7% of their total ability on this day. Please note: without getting too deep into cost detail now, coal plants cost more per MW to construct, while natural gas costs less and nuclear somewhat more, but all in the same ballpark when capitalized over 20-30 years per MW installed. These estimate vary and are increasing rapidly and a separate post is necessary to compare different construction estimates. Texas makes most of its electricity using natural gas, see their profile here.
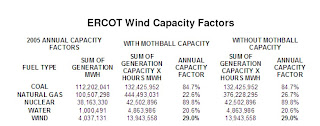 The slide to the left, click to enlarge, shows you the 2005 annual capacity for those 1500 turbines is 29%. That means that the 2300 MW of potential power referred to in the slide above only averages out to less than 800 MW over an entire year. 667 MW is a ONE small coal or natural gas plant which might sit on 20 to 50 acres, while the 1500 turbines each sit on a large concrete pad requiring 4 acres of clear cut in a forested area, a total of 6,000 acres. If we assume the capitalized cost per MW for construction is similar, then the 30% capacity of the wind means the output cost is almost 3 times as much per unit of electricity.
America paid about three times as much per unit of output to build these beasts and let’s see what we got for our money. Our money, because if you are a US Citizen you paid for them in federal tax credits which returned almost 70% of the construction costs to the investors within the first five years.
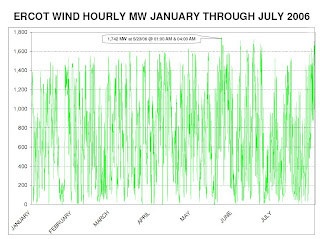 The slide to left the electricity graphs output for ALL 1500 turbines from January to July 2006. Ercot is the grid manager who provides the transmission of electricity to Texas. Outpout is often close to zero and is never over 1750 MW which means turbine output never breaks 75% of their potential, not even for a moment. The output is completely variable during these seven months of data. Can you see the smoothing of power that is so often referred to?
Electricity grids in the US are strained to provide their highest use in the summer months because almost all most air conditioning is produced with electricity. 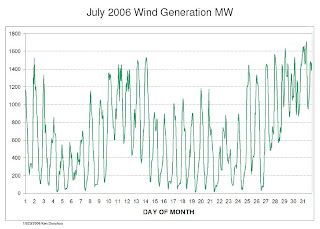 To the right you can see that there is an enormous daily fluctuation of output and output frequently reaches close to zero for these 3 billion dollars worth of turbines. If we had output graphs for nuclear, coal or natural gas the could be essential flat, however natural gas and some coal plants can be precisely adjusted to match the demand of users.
In the blog post below I address that each 15 minute interval has wide oscillations of output and for wind to work their has to be a substitution of fossil energy. Meaning, for every MW produced their has to be a synchronous and immediate decrease in fuel consumption whether that is nat gas or coal. If the speed of the wind varies even by a couple percent that will drastically alter the MW output because E = xV3(velocity cubed, see below or google it for yourself, that is accepted by the wind industry).
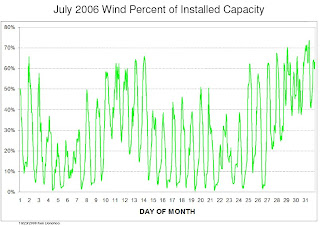 To the right is the wind output for July 2006 but in terms of capacity. The capacity averages about 25% for most of the month with an output rise during the end of the month. Boone Pickens proposes this kind of erratic energy is what America needs and his plan is to construct wind farms then spend billions more to build power lines to supply America with electricity. This might work if we constructed millions of turbines and only needed electricity a few hours per day, when the wind felt like blowing.
Consider that the yearly capacity is 29%, but for that number to be “real” it needs to replace it’s output with an EXACT synchronous amount of fossil fuel. That doesn’t happen because the grid can’t possibly follow those steep curves around. At both the top and the bottom, they would have to be EXACTLY synchronized to wind output and either reducing or increasing the amount of fuel on the fire, and without loss of efficiency. Just like your cars gas mileage becomes less or more efficient at high or low speeds, the same concept generally applies to thermal power plants. Power plants do follow the varying demands of our daily electricity needs, 60% variation in a day is typical, so they are certainly capable of varying their output suddenly, but the fluctuation problem remains. A grid has to ensure that they have an extra reserve so they won’t be caught off guard by a sudden unexpected decrease in wind output. The estimates are that anywhere between 20-40% of the wind output is wasted because of a combination of duplication and loss of efficiency of thermal power by the fossil plants. This fluctuation problem is widely discussed in grid company internal documents wherever wind is installed. Look at the charts on my website and you can see this is an universal problem.
Here is another set of slides where ERCOT, the Texas grid company, considers this problem. Just about every line on those slides is considering the fluctuation and intermittent characteristics of wind, which means ERCOT needs to duplicate a small of wind output with fossil to provide reliability also know as robustness to the grid. But even a 20% duplication lowers the true capacity of a turbine. Are you starting to realize why our electricity experts never thought of this before their state legislatures mandated that they are required to play this silly game! They comply because this is a political decision, not what is best for the consumer. We have no choice, we buy it.
This means that instead of the 29% the figure is only 70% of that if we consider that about 30%(ave of 20/40%) of that energy is duplicated by the fossil to compensate for the fluctuating wind so we get only 20% capacity output. To replace ONE medium-sized 1,000 MW coal or natural gas plant you would need 5,000 turbines, however that would not work because quite often there is little output from the turbines as the charts plainly show.
30 miles from me is a nuclear plant(environmentally friendly, on about 30 acres) that is rated at 2400 MW and it ran at that level continuously all last year. The same amount of energy would need over 6,000 MW turbines with 25% yearly capacity and 80% replacement of fossil fuel to match its output. 6,000 × 2 MW × .25 cap × .80% fossil replacement = 2400 MW. But, the charts above demonstrate that the turbines often produce almost nothing in the summer and in the middle of the afternoon when our needs are the highest.
Either Boone Pickens is a great shyster or he doesn’t understand wind!!!
You electricity grid is always planning for the worst case scenario and that is the peak electricity use during the hot summer months of high air conditioning needs. Especially in Texas! 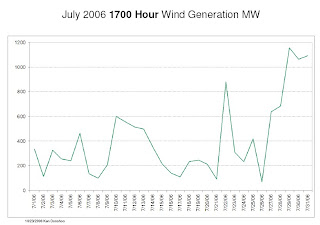 The chart to the right graphs the wind output at 5PM during the hot month of July. An eyeball average would be 350 MW output with some days only 100 MW produced, out of a possible 2300 MW! On those days billions of dollars of transmission lines will side IDLE, click, yes billions.
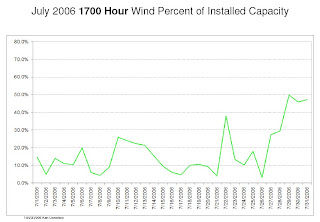 To the left is the same MW output but expressed in terms of capacity. The output often stays below the 10% line for much of the month, meaning if the constructions costs were similar, you are getting only 10% of wind for your money compared to coal or gas. ERCOT, the electricity grid company of Texas, needs a margin of safety while planning and originally gave the wind farms a 2.9% capacity credit while planning, which they call their “confidence factor”. See page 19 here. (later they considered raising it to between 5-16%).
If you are an American who cares about our deficit, this should bring tears to your eyes. Much of the wasted cost on construction and further production tax credits are piled right on our federal budget. Then the states force the grid companies to purchase the wind output and provide additional state incentives and tax breaks. Finally a federal Production Tax credit of 2.1cents is given for every kWhour produced which for many states is 20% of your per kWh electric bill.
There is no amount of green utopia wishful thinking(ie. their prayers) that will allow Texas to contribute useful energy to our electricity grid nationally. NONE! 3% CONFIDENCE, remember that number, and next time you see Boone tell him you are 3% confident in his Big Man’s Plan! Maybe instead of wind farms we should call them swindle farms. And remember, Texas is number two! I couldn’t bear the misery of looking at the reality of our other states that are not so windy. The Wind is not FREE!!!
This material is the work of the author(s) indicated. Any opinions expressed in it are not necessarily those of National Wind Watch.
The copyright of this material resides with the author(s). As part of its noncommercial educational effort to present the environmental, social, scientific, and economic issues of large-scale wind power development to a global audience seeking such information, National Wind Watch endeavors to observe “fair use” as provided for in section 107 of U.S. Copyright Law and similar “fair dealing” provisions of the copyright laws of other nations. Queries e-mail.
| Wind Watch relies entirely on User Funding |
 (via Stripe) |
 (via Paypal) |
Share:
Tags: Wind power, Wind energy

